ProgrammingInJulia
MS18 #discussion channel
Project maintained by DhruvaSambrani Hosted on GitHub Pages — Theme by mattgraham
Check out the videos in order
Discussion topics
These were the side discussions discussed in Part 4.
- Pluto - Cell dependency
- Cyclic dependency
- Pluto vs Jupyter
- Optimizations
- Algorithmic - Barnes-Hut Optimization
- Implementation -
- Static Typing
forcecalculation only once for each pair. Create an upper triangular matrix- In-place updating
forcewith .+= instead of = - Preallocating
trajectoryandforcesinsimulate
- Hardware - GPU
- Solving differential equations
- Euler
- Leap-frog
- Range-Kutta
- Machine Learning solution to the N-Body problem - Associated Arxiv paper
Completed Pluto Notebook
Results
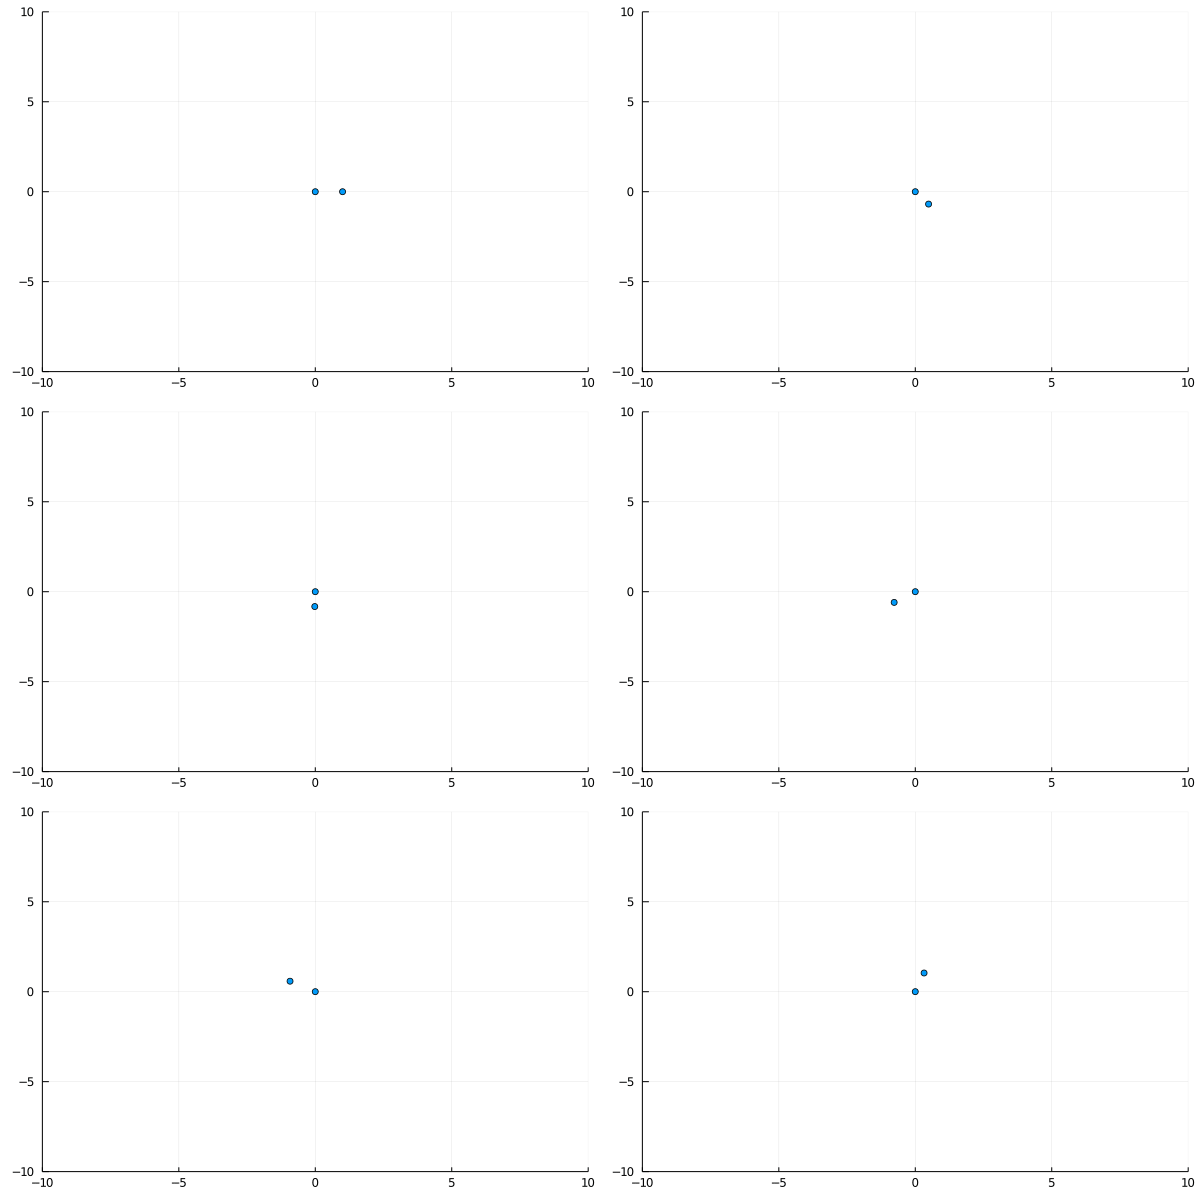
Some animation. I forgot what the parameters were :P

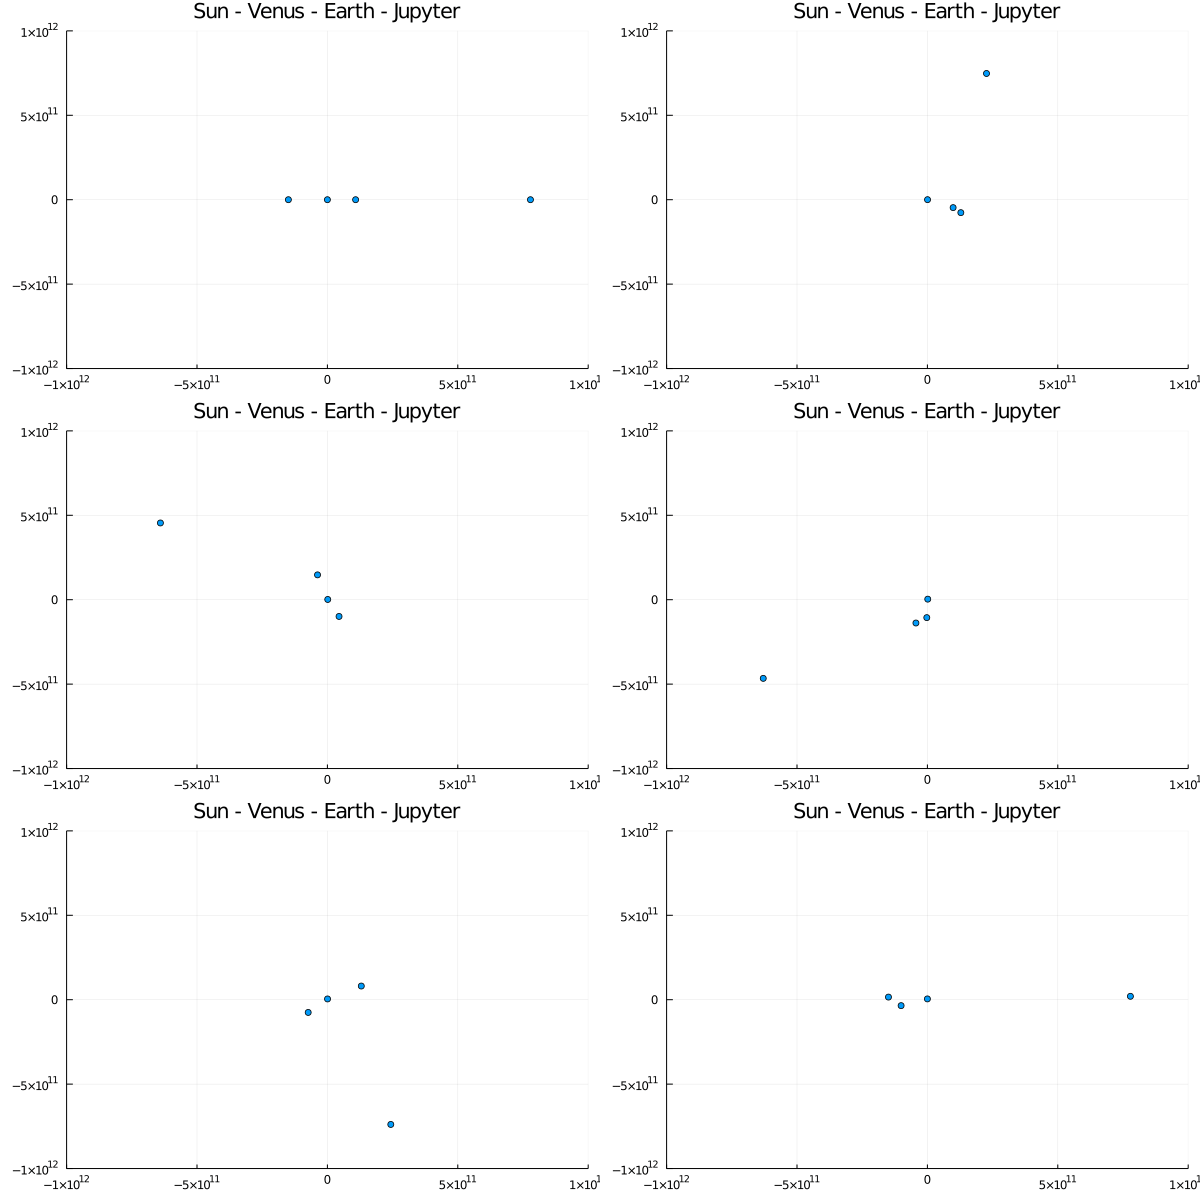
Solar system
As mentioned in the video, I’ve taken planetary data from NASA and I’ve run an animation for 12 earth years (1 Jupyter year), with a time step of 1 day. dt of one week is too inaccurate
It ran in a pretty short time, so I suppose you could add the rest of the planets too, but I don’t suppose it will change much.
I’ve plotted at the 10th time step (10 days) and created a gif at 30fps. So every second is about 10 months

What next?
- Try to implement this in Python and see the speed difference. Use numpy and then compare.
- Try to optimize my code as I’ve mentioned in the Implementation Optimizations in the Discussion Topics. Use the julia docs to the fullest. Using BenchmarkTools to profile your code!
- Implement a 3d version of the code. You’ll see how easy it is to change it. Only
forceneeds to be initialized as a 3 vector, and plot the z component too, asscatter(xs, ys, zs, ...). Try the same in Python. Note that gr doesn’t give you a nice rotatable 3d plot. You can either use thecameraargument in thescatter(...)or, what I prefer, is to use the Plotly or PlotlyJS backends. More info can be found in the Plots.jl docs. FIRST PLOTS TAKE TIME. Use planetary data from NASA and also use theOrbital Inclinationparameter in the dataset to set your initial conditions. If possible, use data for planets on some day, instead of the averages. - Implement the Barnes-Hut Optimization. Don’t cheat.
- Collisions? Either simulate it using a central force which falls very quickly (see Patta’s notes for more detail), or make them “stick” together(How?). This will need you to add a radius to the planet.
- Perturb the system? Launch a small asteroid. See Jupiter’s screening effect in play.
- Add the Moon! You may need to zoom in by setting the
xlimsandylimsto see the moon separately from the earth. - Set up 2 solar systems (Just use 4/5 planets) some distance from each other, such that there is a binary star system. You may need to give some initial velocity to the suns. Is a “stable” orbit possible? Simulate for long time scales.
- Should we use a variable
dt? When objects are very close, they tend to accelerate quickly. Using smallerdtfor this is better, while we can use largerdtfor smaller forces. How will you calculate thisdt? Try some guess functions. Make sure to use the samedtfor each planet, otherwise they’ll end being in different times!